Premise
AUGMENTED SITUATIONAL AWARENESS
In 2013 we started working with a German company that provides solutions in the video security technology sector. On top of manufacturing surveillance equipment they also offered turn key installation services for premises such as airports, casinos, stadiums or smart cities.
The client’s ambitions were varied and grew in scope over time but remained centered around two concepts.
- Provide planners with a simple and efficient tool to create, visualize and edit buildings / Internet of Things(IoT) device(s) during the hardware installation phase.
- Provide operators with optimal situational awareness by offering real-time contextual information allowing them to make better decisions during the operational phase.
What we developed
FRONTEND
The frontend was composed of an Editing and a Monitoring application. A Digital Twins engine running on a custom 3D engine was used for both.
Editor
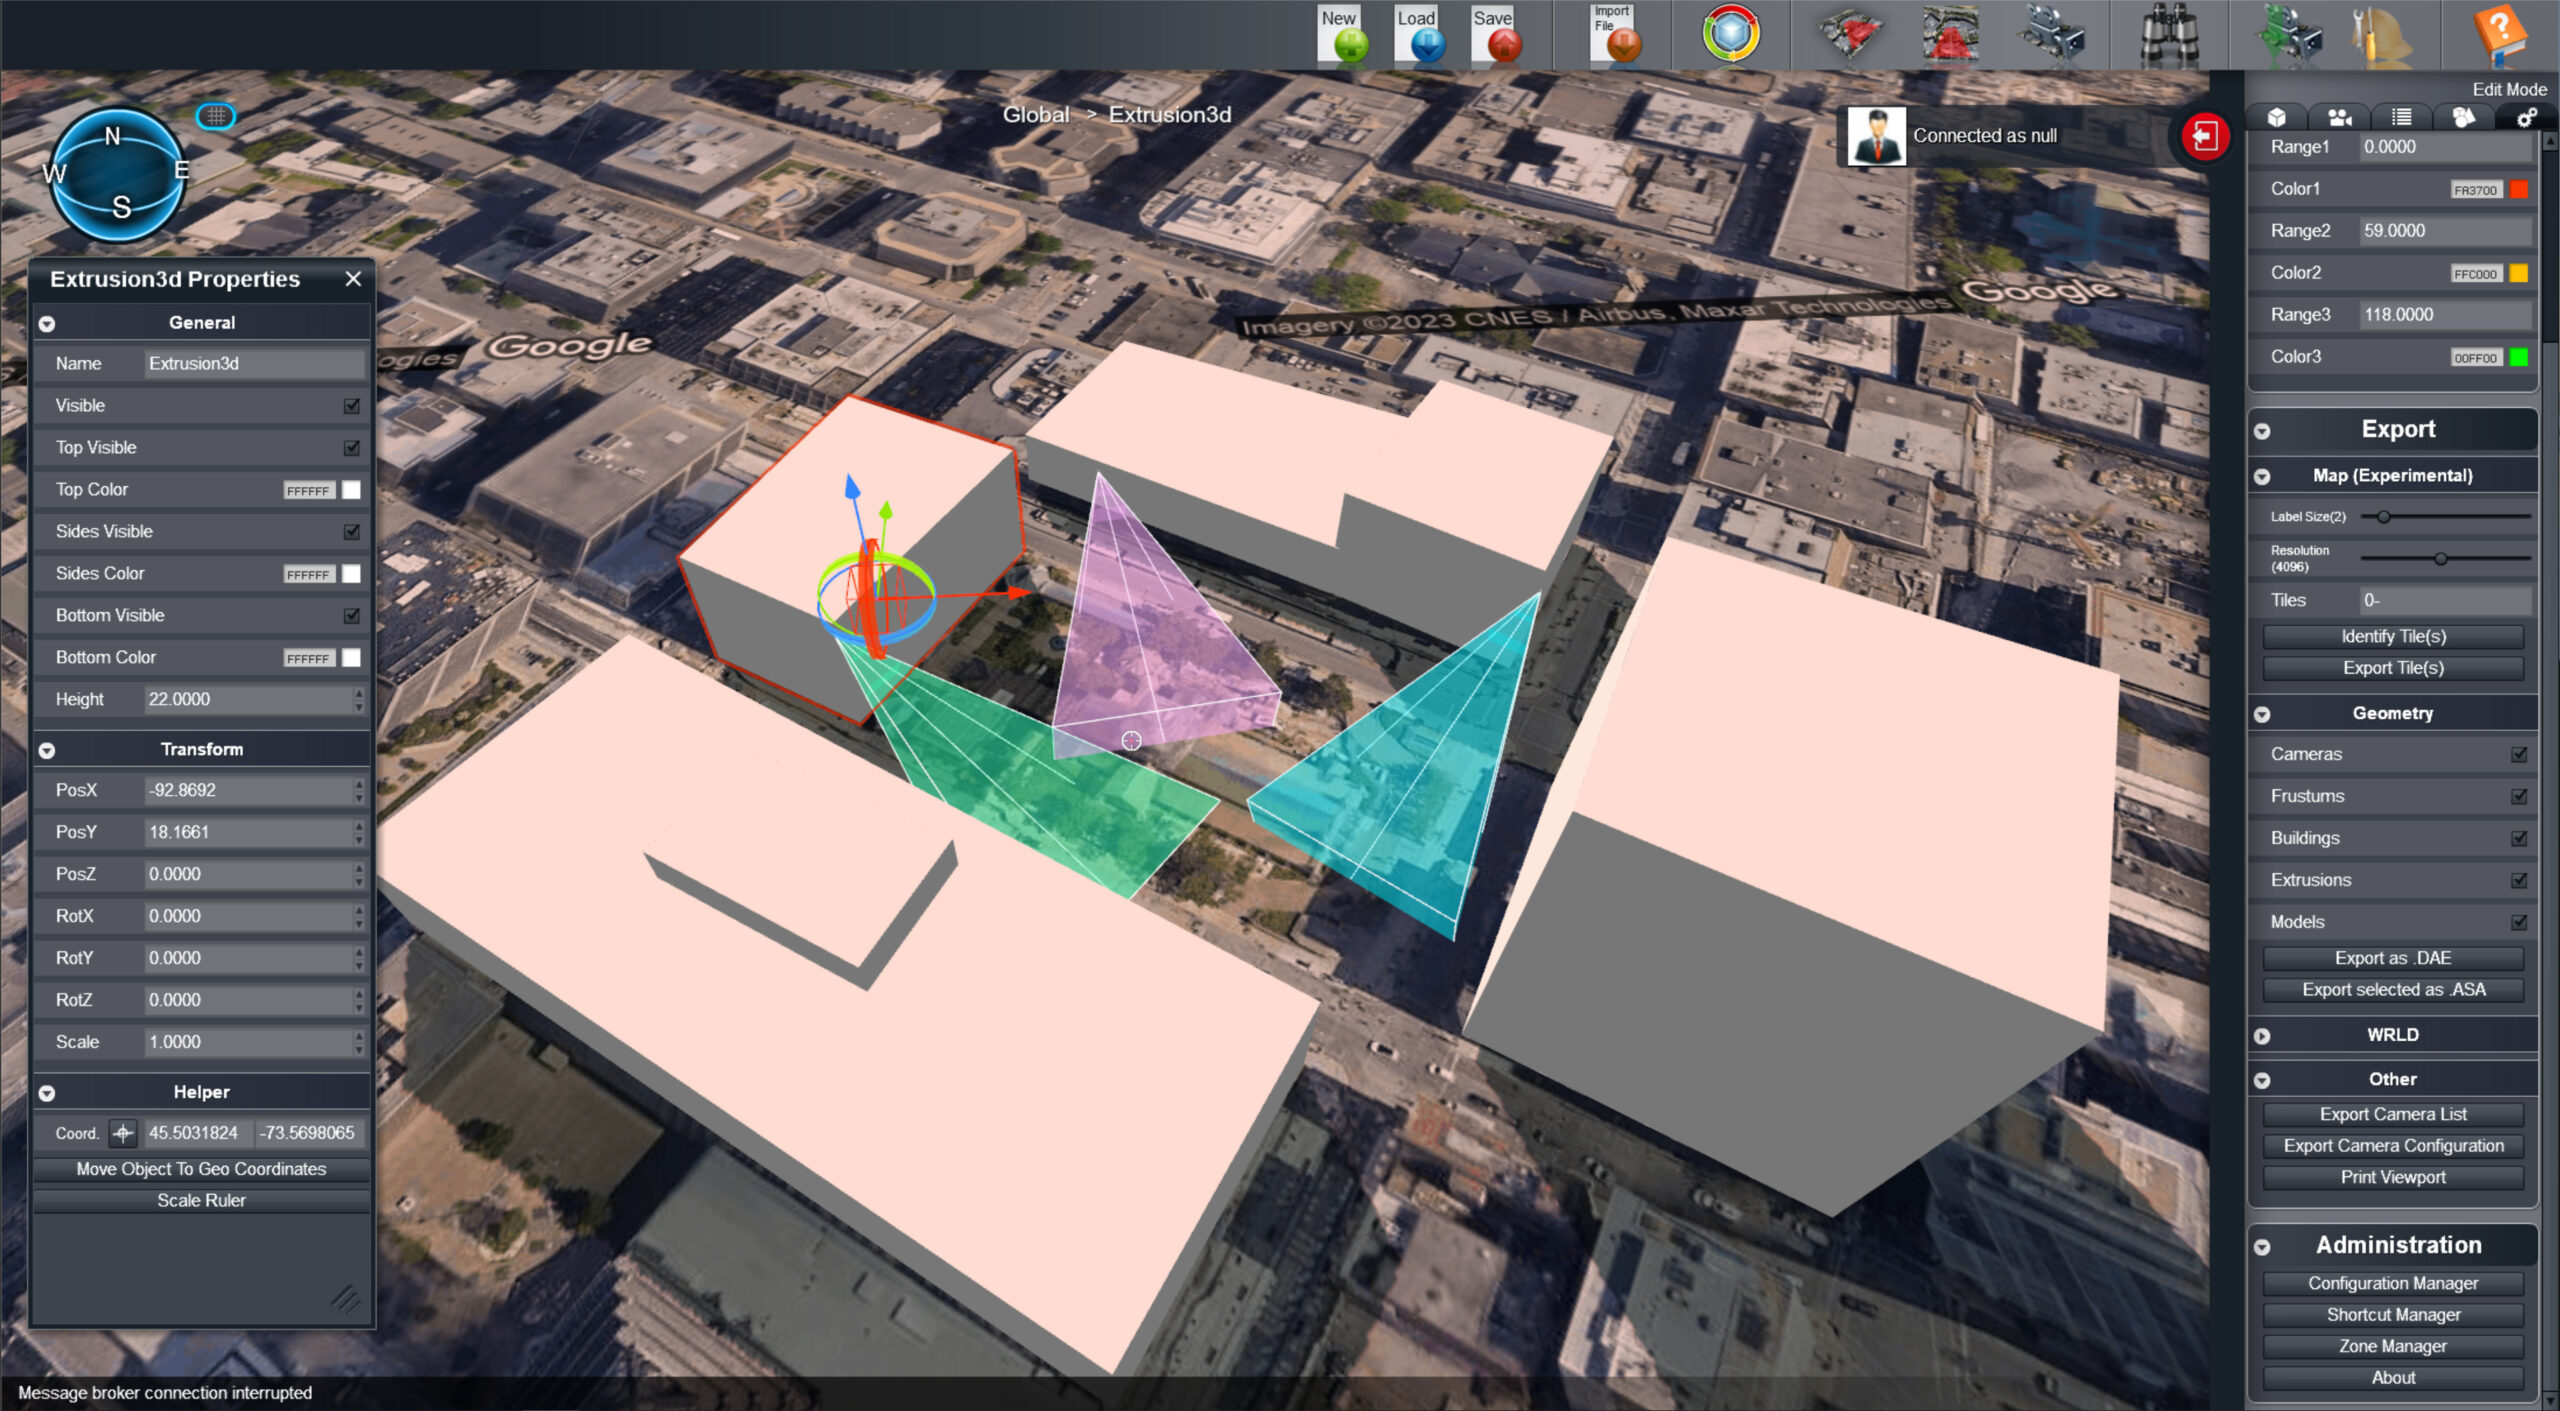
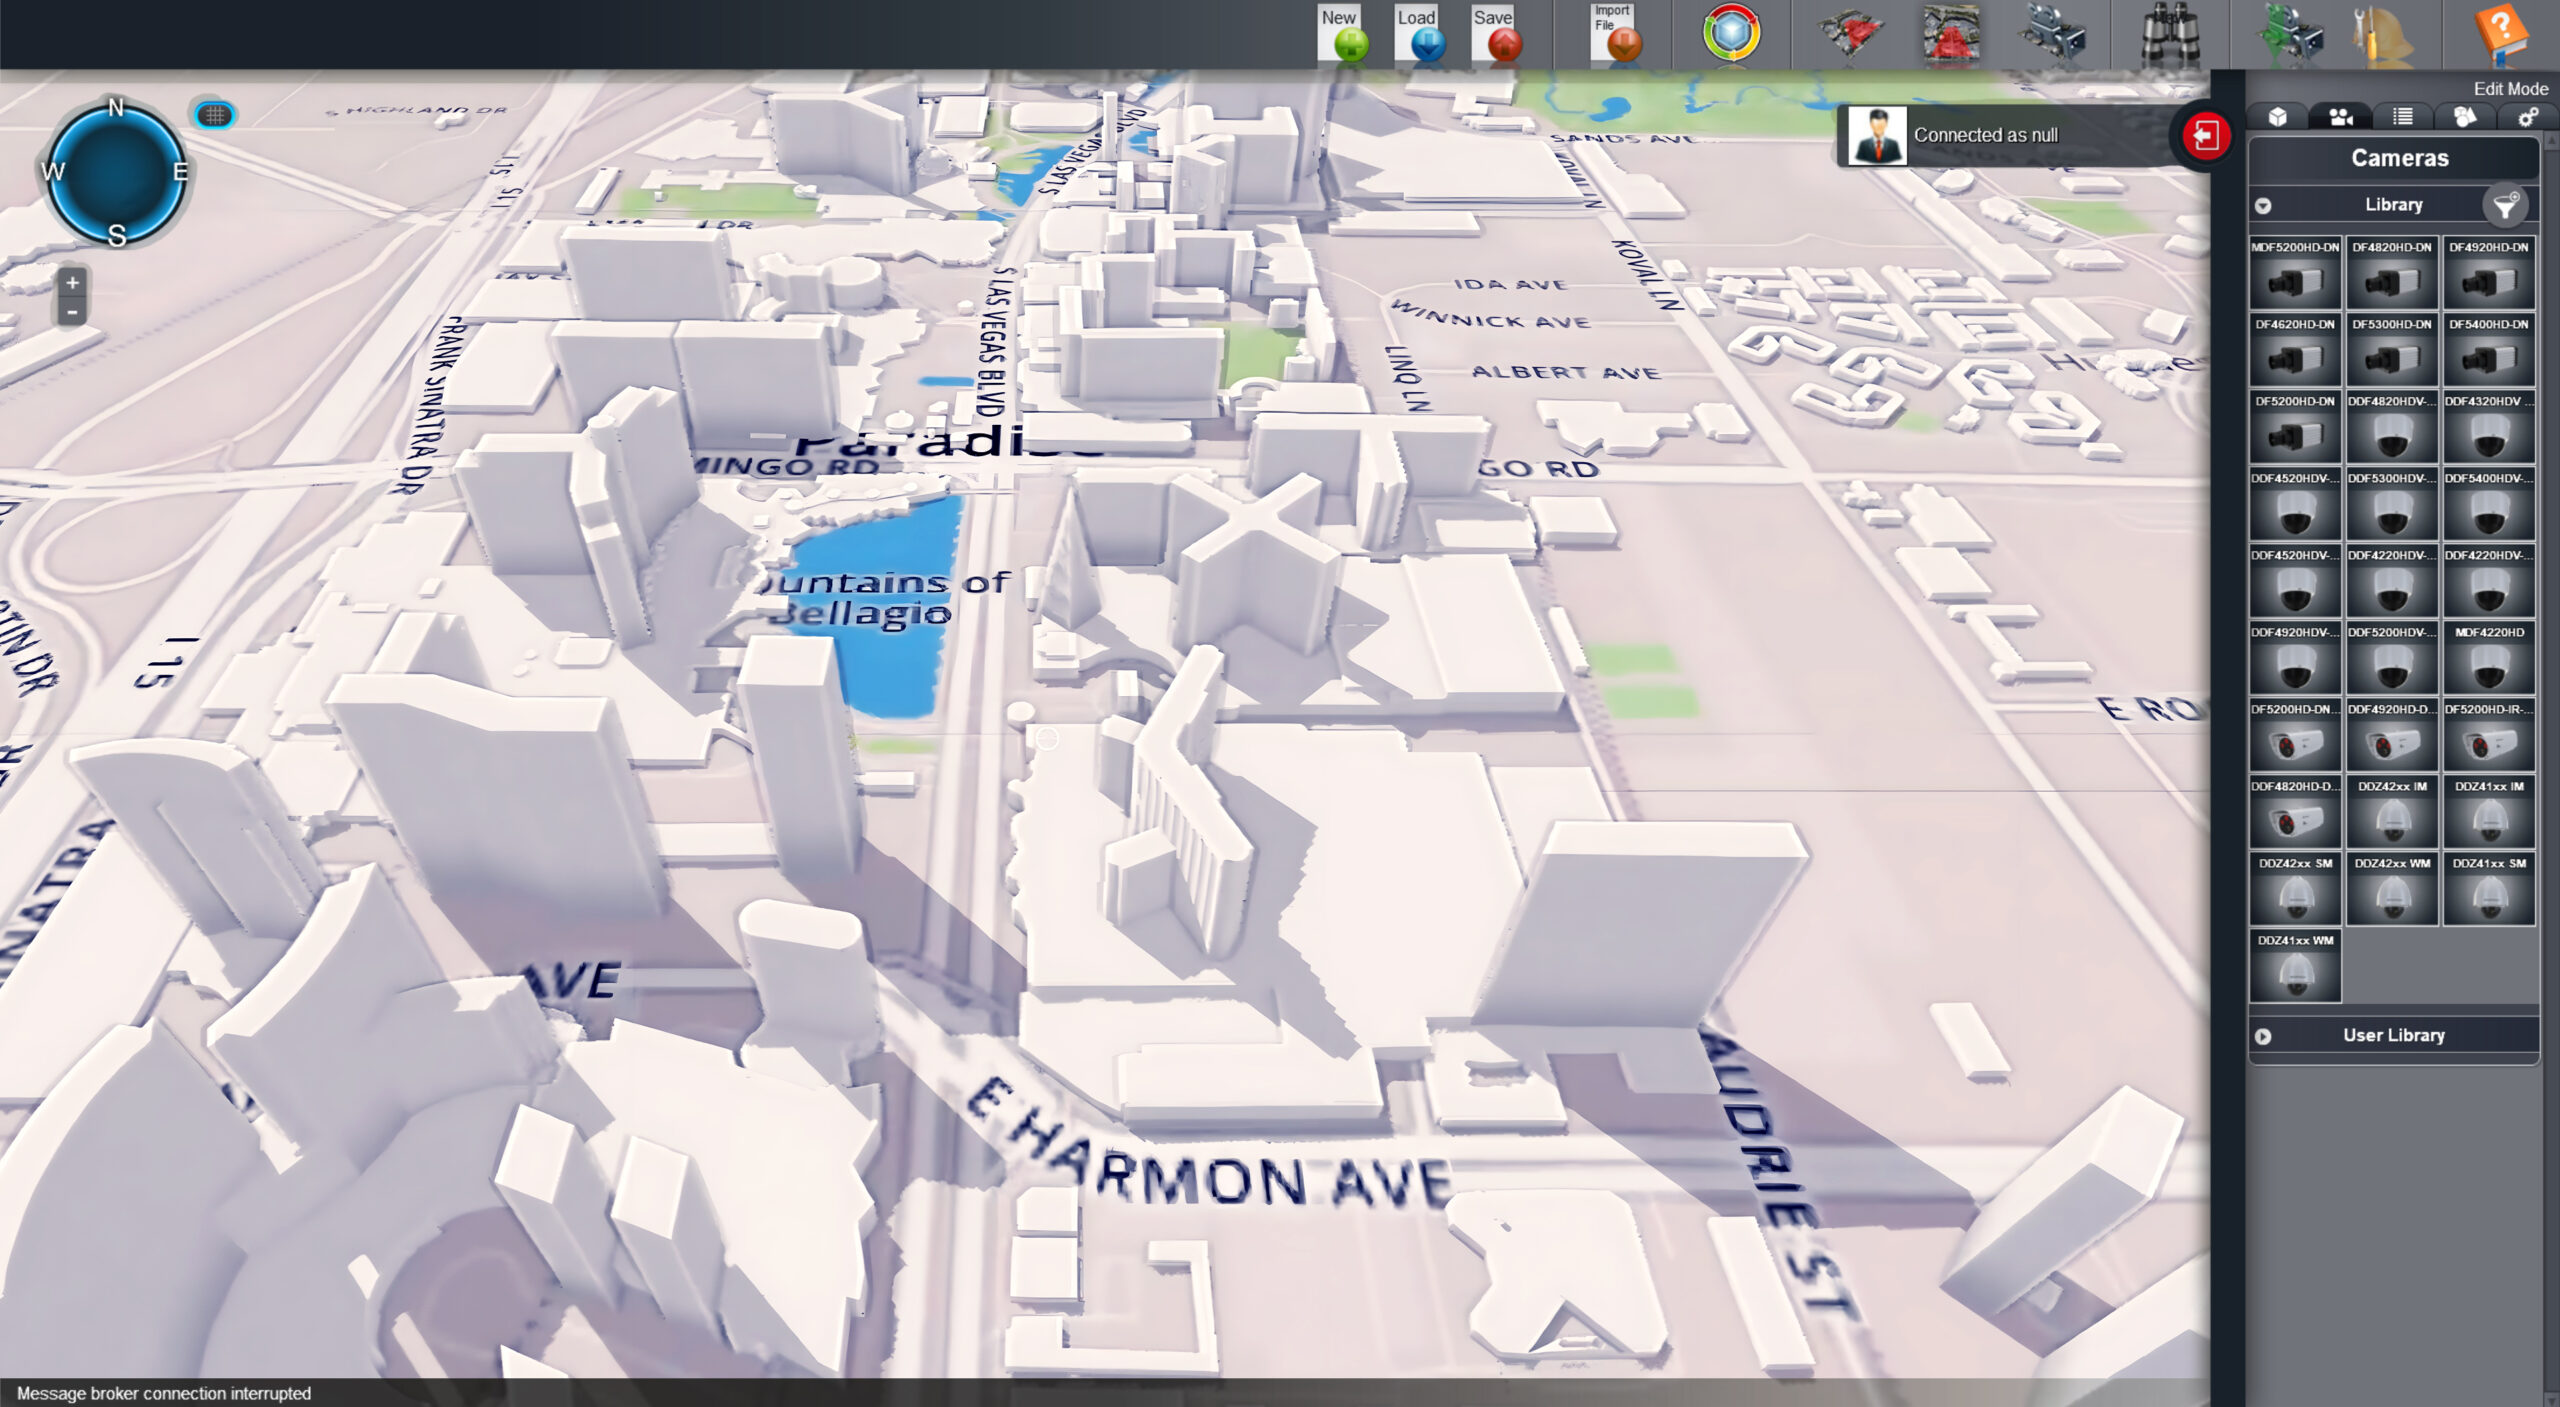
The Editor application was a Computer-Aided Design(CAD) software used for the creation of Digital Twins building(s) and the configuration and placement of IoT device(s) such as cameras.
Research was done to find efficient ways of visualizing devices coverage of monitored areas. For example camera Viewing Frustums were projected onto the geometry with different colors being assigned to the different DORI(Detection, Observation, Recognition, Identification) level of details. A rich visual representation would allow planners to cover monitored areas using fewer devices making the installation faster and more cost effective.
Other smaller tools such as a Device manager allowed users to create Device models of commonly used devices which could then be instanced by dragging and dropping them into the scene. Complex state visuals could be configured to be displayed in the monitoring application without the need for coding. For instance a door could have a visual associated with its “Locked” state and another for its “Unlocked” state. Other more specialized device configuration tools made it possible to configure the sensors of a multi-sensor camera cluster or define predetermined path for surveillance drones.
Import and export parsers for commonly(and not so commonly) used formats such as .dae were introduced to allow for proper interoperability of data coming from popular software such as Autocad.
Monitoring
The Monitoring application was designed to be used by operators for real-time site surveillance and information coordination with security or law enforcement agents.
Devices, whether the stream of a camera, the number of people in a room or the state of a door or window, would have their state represented visually and contextually. When proper circumstances were met, events generated by the backend would be displayed to users(provided they had the proper account privilege) in order to attract their attention to specific situations.
Built-in user messaging and report forms would accommodate the different communication / archival needs.
Special attention was given to user experience to make sure that the UI would be easy to use, intuitive and in line with preexisting industry standards.
What we developed
BACKEND
The backend was composed of Device, Persistence and Analytics components and a Message broker for real-time data synchronization.
Device
The Device component was responsable for interfacing with a wide range of hardware IoT devices such as:
-
- Camera
- Door lock
- Card reader
- People counter
- Parking barrier gate
- Window break sensor
- Motion detector
- . . .
Persistence
The Persistence component was host to a variety of data such as:
-
- Physicalized objects in the form of 3D buildings or devices and their states(Persisted within a hierarchical scene graph).
- Device models created in the Device Manager(See Frontend section for more details).
- User communication such as reports or messages(Persisted in a transactional database).
- Assets such as texture or 3D geometry(Persisted on the file system).
- . . .
Analytics
The Analytics component acted as the brains of the backend and provided additional information such as:
-
- Point to point building pathfinding which would leverage the Digital Twins 3D data and also take into consideration a persons access rights over doors and card readers.
- Best camera identifier which would return the camera with the best visibility over any given point.
- . . .
Components were delivered as Docker containers and designed with modularity in mind as some(such as the Analytics) were optional and could be included or not depending on the specific needs of the client.
Depending on the client the network did not necessarily have access to the internet, the system therefore had to be self reliant for security reasons.

How we did it
Methodology
With such a large scope and so many things to figure out, development had to be very agile. Each cycle would start with thoughtful planning where we tried to look as far into the future as possible and think of requirements that would far exceed those provided. This ensured that anything we designed was as robust, extensible, modular and futureproof as possible without taking much longer to develop.
The project took several years to complete with multiple months being spend on premises in Germany. The collaboration ended up being both a great learning experience and a culturally enriching one for those involved.